Investigation of double-peak separation#
%load_ext autoreload
%autoreload 2

import numpy as np
import arviz as az
import pymc as pm
from pathlib import Path
from peak_performance import pipeline as pl, models, plots
from matplotlib import pyplot as plt
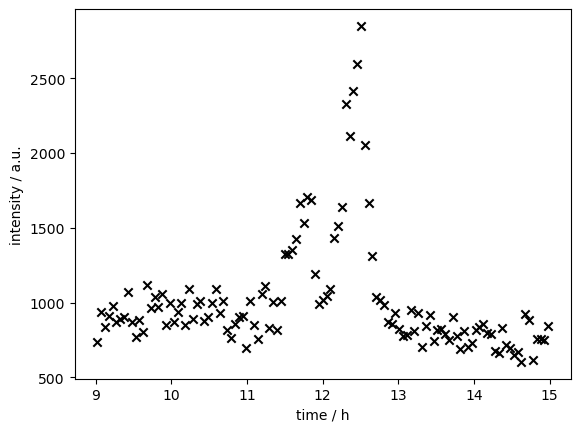
Load and inspect raw intensity data#
timeseries = np.load(Path(r"..\example\A2t2R1Part1_132_85.9_86.1.npy"))

fig, ax = plt.subplots()
ax.scatter(timeseries[0], timeseries[1], marker="x", color="black")
ax.set(
    xlabel="time / h",
    ylabel="intensity / a.u.",
)
plt.show()
Define a peak model#
pmodel = models.define_model_double_normal(
    time=timeseries[0],
    intensity=timeseries[1]
)
pmodel.to_graphviz()
c:\Users\osthege\AppData\Local\mambaforge\envs\pepe\Lib\site-packages\pymc\data.py:273: FutureWarning: ConstantData is deprecated. All Data variables are now mutable. Use Data instead.
  warnings.warn(

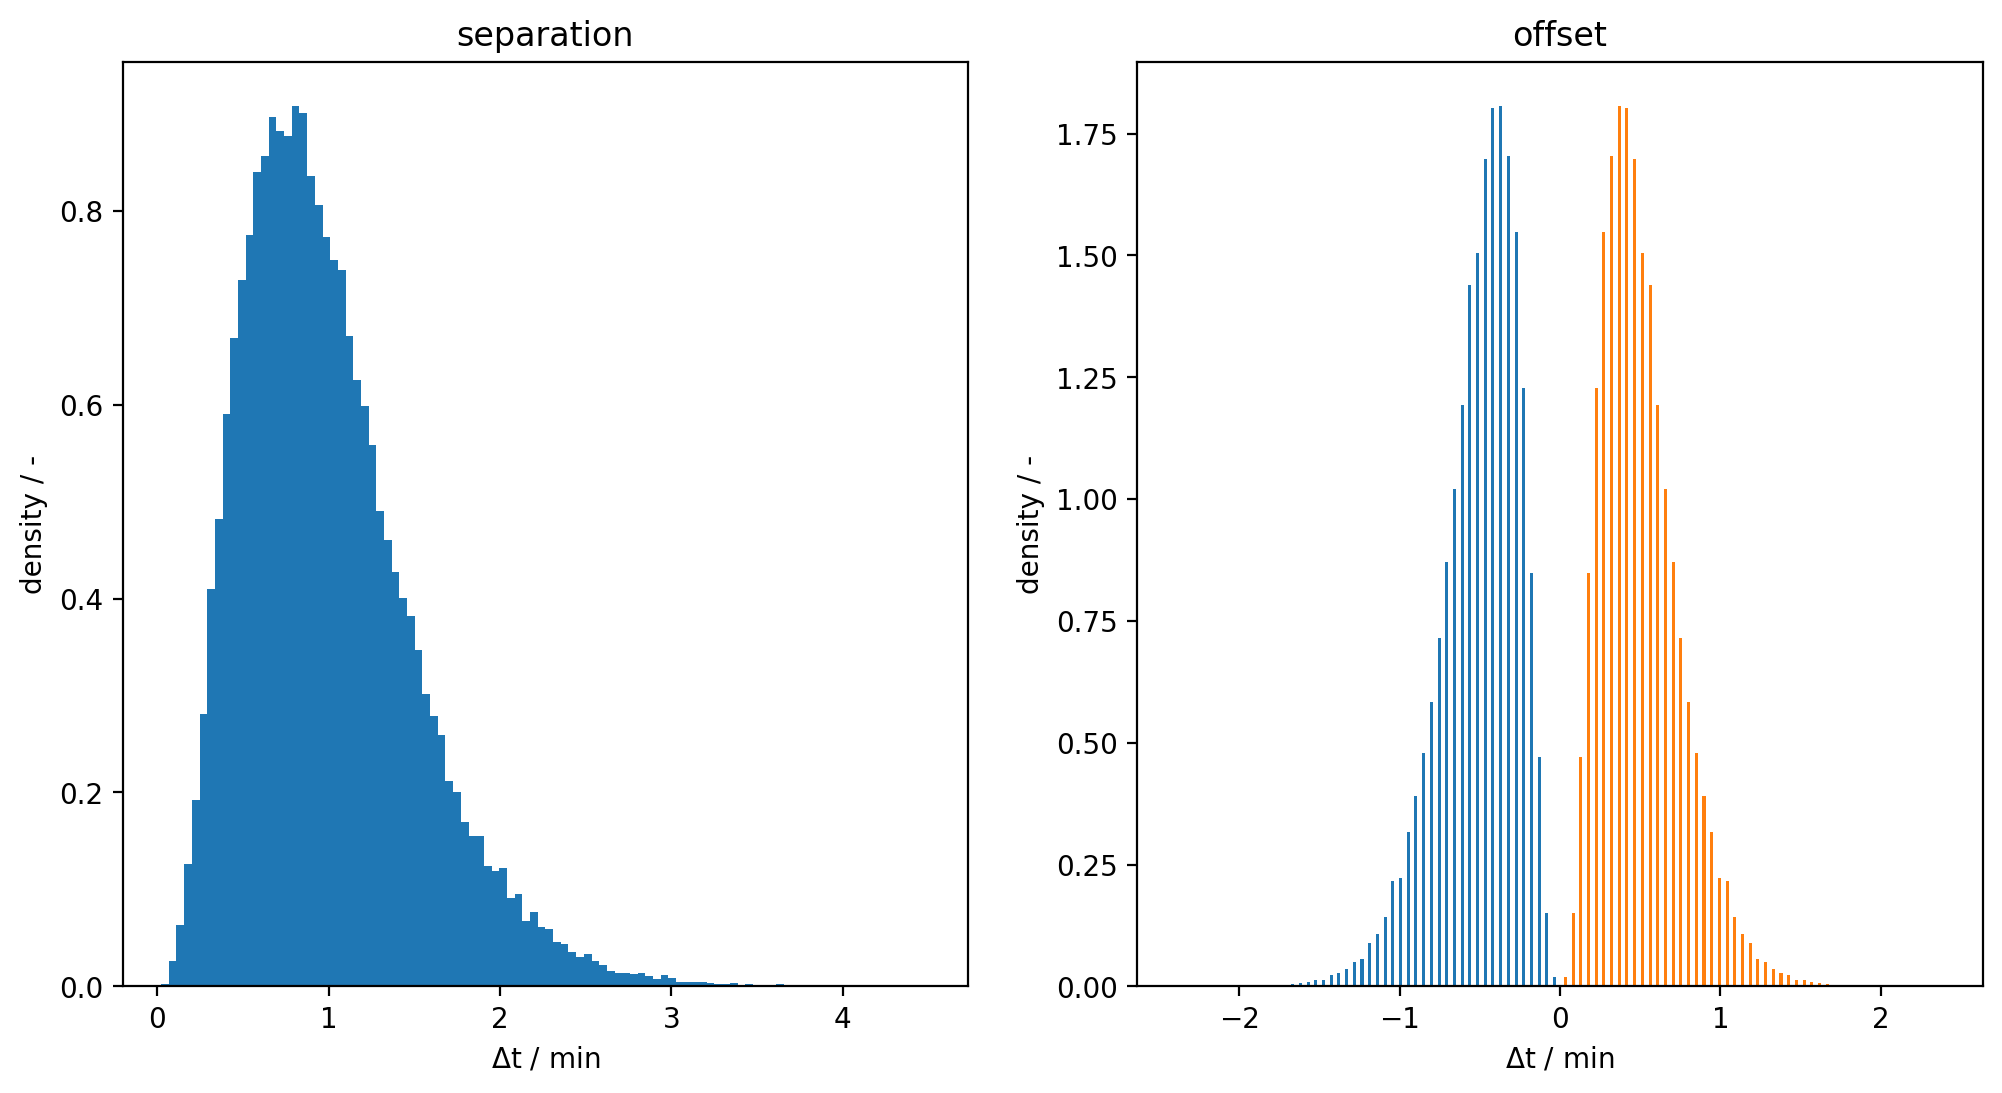
Inspect priors for separation and retention time#
fig, axs = plt.subplots(dpi=200, ncols=2, figsize=(12, 6))
ax = axs[0]
ax.hist(pm.draw(pmodel["separation"], draws=50000), bins=100, density=True)
ax.set(ylabel="density / -", xlabel="$\mathrm{\Delta t\ /\ min}$", title="separation")

ax = axs[1]
ax.hist(pm.draw(pmodel["offset"], draws=50000), bins=100, density=True)
ax.set(ylabel="density / -", xlabel="$\mathrm{\Delta t\ /\ min}$", title="offset")
plt.show()
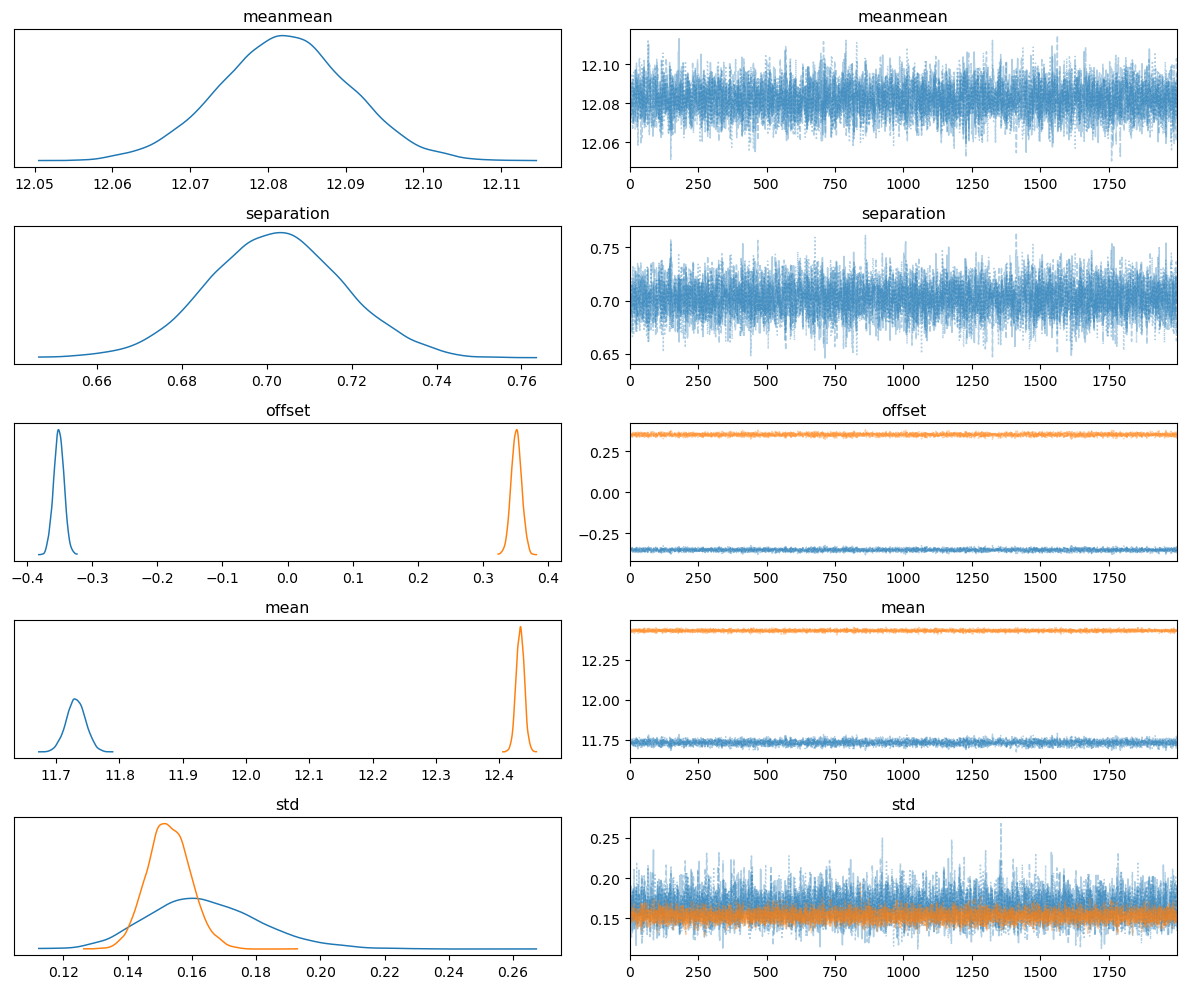
Run MCMC sampling and inspect results#
idata = pl.sampling(pmodel, tune=6_000, draws=2000)
idata = pl.posterior_predictive_sampling(pmodel, idata)
idata
Sampling: [L, baseline_intercept, baseline_slope, height, meanmean, noise, separation, std]
100.00% [32000/32000 00:03<00:00 Sampling chains: 0, Divergences: 0]
Sampling: [L]
arviz.InferenceData
-
<xarray.Dataset> Size: 17MB Dimensions: (chain: 4, draw: 2000, subpeak: 2, baseline_dim_0: 119, height_log___dim_0: 2, std_log___dim_0: 2, y_dim_0: 119) Coordinates: * chain (chain) int32 16B 0 1 2 3 * draw (draw) int32 8kB 0 1 2 3 4 ... 1995 1996 1997 1998 1999 * subpeak (subpeak) int64 16B 0 1 * baseline_dim_0 (baseline_dim_0) int32 476B 0 1 2 3 ... 115 116 117 118 * height_log___dim_0 (height_log___dim_0) int32 8B 0 1 * std_log___dim_0 (std_log___dim_0) int32 8B 0 1 * y_dim_0 (y_dim_0) int32 476B 0 1 2 3 4 5 ... 114 115 116 117 118 Data variables: (12/17) area (chain, draw, subpeak) float64 128kB 292.9 ... 681.8 baseline (chain, draw, baseline_dim_0) float64 8MB 954.0 ... 7... baseline_intercept (chain, draw) float64 64kB 1.19e+03 ... 1.1e+03 baseline_slope (chain, draw) float64 64kB -26.11 -25.44 ... -20.51 height (chain, draw, subpeak) float64 128kB 719.0 ... 1.795e+03 height_log__ (chain, draw, height_log___dim_0) float64 128kB 6.578... ... ... separation (chain, draw) float64 64kB 0.7089 0.7019 ... 0.7021 separation_log__ (chain, draw) float64 64kB -0.344 -0.3539 ... -0.3537 sn (chain, draw, subpeak) float64 128kB 6.711 ... 13.91 std (chain, draw, subpeak) float64 128kB 0.1625 ... 0.1515 std_log__ (chain, draw, std_log___dim_0) float64 128kB -1.817 .... y (chain, draw, y_dim_0) float64 8MB 954.0 952.6 ... 793.0 Attributes: created_at: 2024-05-11T12:17:52.526279+00:00 arviz_version: 0.18.0 inference_library: nutpie inference_library_version: 0.10.0 sampling_time: 4.014691591262817 -
<xarray.Dataset> Size: 8MB Dimensions: (chain: 4, draw: 2000, L_dim_2: 119) Coordinates: * chain (chain) int32 16B 0 1 2 3 * draw (draw) int32 8kB 0 1 2 3 4 5 6 ... 1994 1995 1996 1997 1998 1999 * L_dim_2 (L_dim_2) int32 476B 0 1 2 3 4 5 6 ... 112 113 114 115 116 117 118 Data variables: L (chain, draw, L_dim_2) float64 8MB 972.6 869.8 ... 953.9 902.5 Attributes: created_at: 2024-05-11T12:17:56.042562+00:00 arviz_version: 0.18.0 inference_library: pymc inference_library_version: 5.14.0 -
<xarray.Dataset> Size: 664kB Dimensions: (chain: 4, draw: 2000) Coordinates: * chain (chain) int32 16B 0 1 2 3 * draw (draw) int32 8kB 0 1 2 3 4 ... 1996 1997 1998 1999 Data variables: depth (chain, draw) uint64 64kB 4 4 3 4 4 3 ... 3 4 4 4 3 3 diverging (chain, draw) bool 8kB False False ... False False energy (chain, draw) float64 64kB 758.4 757.7 ... 756.5 755.8 energy_error (chain, draw) float64 64kB 1.1 -0.5713 ... -0.01884 index_in_trajectory (chain, draw) int64 64kB -12 7 3 6 11 ... -13 -2 4 -3 logp (chain, draw) float64 64kB -756.9 -753.8 ... -754.3 maxdepth_reached (chain, draw) bool 8kB False False ... False False mean_tree_accept (chain, draw) float64 64kB 0.6921 0.9064 ... 0.9815 mean_tree_accept_sym (chain, draw) float64 64kB 0.7823 0.7249 ... 0.9674 n_steps (chain, draw) uint64 64kB 15 15 7 15 15 ... 15 15 7 15 step_size (chain, draw) float64 64kB 0.527 0.527 ... 0.5042 step_size_bar (chain, draw) float64 64kB 0.527 0.527 ... 0.5042 Attributes: created_at: 2024-05-11T12:17:52.485278+00:00 arviz_version: 0.18.0 -
<xarray.Dataset> Size: 1MB Dimensions: (chain: 1, draw: 500, subpeak: 2, baseline_dim_0: 119, y_dim_0: 119) Coordinates: * chain (chain) int32 4B 0 * draw (draw) int32 2kB 0 1 2 3 4 5 ... 494 495 496 497 498 499 * subpeak (subpeak) int32 8B 0 1 * baseline_dim_0 (baseline_dim_0) int32 476B 0 1 2 3 ... 115 116 117 118 * y_dim_0 (y_dim_0) int32 476B 0 1 2 3 4 5 ... 114 115 116 117 118 Data variables: (12/13) area (chain, draw, subpeak) float64 8kB 8.142e+03 ... 1.47... baseline (chain, draw, baseline_dim_0) float64 476kB 769.9 ...... baseline_intercept (chain, draw) float64 4kB 883.3 1.037e+03 ... 1.045e+03 baseline_slope (chain, draw) float64 4kB -12.56 -20.54 ... -19.59 height (chain, draw, subpeak) float64 8kB 2.467e+03 ... 3.85... mean (chain, draw, subpeak) float64 8kB 11.14 11.59 ... 12.23 ... ... noise (chain, draw) float64 4kB 60.87 115.0 ... 75.03 20.01 offset (chain, draw, subpeak) float64 8kB -0.2253 ... 0.8738 separation (chain, draw) float64 4kB 0.4505 1.284 ... 0.6101 1.748 sn (chain, draw, subpeak) float64 8kB 40.53 60.56 ... 192.8 std (chain, draw, subpeak) float64 8kB 1.317 1.494 ... 1.525 y (chain, draw, y_dim_0) float64 476kB 2.29e+03 ... 1.5... Attributes: created_at: 2024-05-11T12:16:23.869505+00:00 arviz_version: 0.18.0 inference_library: pymc inference_library_version: 5.14.0 -
<xarray.Dataset> Size: 478kB Dimensions: (chain: 1, draw: 500, L_dim_0: 119) Coordinates: * chain (chain) int32 4B 0 * draw (draw) int32 2kB 0 1 2 3 4 5 6 7 ... 493 494 495 496 497 498 499 * L_dim_0 (L_dim_0) int32 476B 0 1 2 3 4 5 6 ... 112 113 114 115 116 117 118 Data variables: L (chain, draw, L_dim_0) float64 476kB 2.238e+03 ... 1.484e+03 Attributes: created_at: 2024-05-11T12:16:23.891507+00:00 arviz_version: 0.18.0 inference_library: pymc inference_library_version: 5.14.0 -
<xarray.Dataset> Size: 1kB Dimensions: (L_dim_0: 119) Coordinates: * L_dim_0 (L_dim_0) int32 476B 0 1 2 3 4 5 6 ... 112 113 114 115 116 117 118 Data variables: L (L_dim_0) float64 952B 737.0 940.0 834.0 ... 755.0 753.0 844.0 Attributes: created_at: 2024-05-11T12:16:23.897502+00:00 arviz_version: 0.18.0 inference_library: pymc inference_library_version: 5.14.0 -
<xarray.Dataset> Size: 3kB Dimensions: (intensity_dim_0: 119, time_dim_0: 119) Coordinates: * intensity_dim_0 (intensity_dim_0) int32 476B 0 1 2 3 ... 115 116 117 118 * time_dim_0 (time_dim_0) int32 476B 0 1 2 3 4 ... 114 115 116 117 118 Data variables: intensity (intensity_dim_0) float64 952B 737.0 940.0 ... 844.0 intercept_guess float64 8B 990.5 noise_width_guess float64 8B 97.15 slope_guess float64 8B -17.95 time (time_dim_0) float64 952B 9.023 9.073 ... 14.93 14.98 Attributes: created_at: 2024-05-11T12:16:23.905523+00:00 arviz_version: 0.18.0 inference_library: pymc inference_library_version: 5.14.0 -
<xarray.Dataset> Size: 50MB Dimensions: (chain: 4, draw: 6000, subpeak: 2, baseline_dim_0: 119, height_log___dim_0: 2, std_log___dim_0: 2, y_dim_0: 119) Coordinates: * chain (chain) int32 16B 0 1 2 3 * draw (draw) int32 24kB 0 1 2 3 4 ... 5995 5996 5997 5998 5999 * subpeak (subpeak) int64 16B 0 1 * baseline_dim_0 (baseline_dim_0) int32 476B 0 1 2 3 ... 115 116 117 118 * height_log___dim_0 (height_log___dim_0) int32 8B 0 1 * std_log___dim_0 (std_log___dim_0) int32 8B 0 1 * y_dim_0 (y_dim_0) int32 476B 0 1 2 3 4 5 ... 114 115 116 117 118 Data variables: (12/17) area (chain, draw, subpeak) float64 384kB 1.524 ... 635.1 baseline (chain, draw, baseline_dim_0) float64 23MB 4.793 ... ... baseline_intercept (chain, draw) float64 192kB -0.7646 ... 1.147e+03 baseline_slope (chain, draw) float64 192kB 0.6159 0.6159 ... -23.96 height (chain, draw, subpeak) float64 384kB 0.2454 ... 1.786... height_log__ (chain, draw, height_log___dim_0) float64 384kB -1.40... ... ... separation (chain, draw) float64 192kB 0.5358 0.5358 ... 0.6774 separation_log__ (chain, draw) float64 192kB -0.624 -0.624 ... -0.3895 sn (chain, draw, subpeak) float64 384kB 0.6005 ... 15.42 std (chain, draw, subpeak) float64 384kB 2.477 ... 0.1419 std_log__ (chain, draw, std_log___dim_0) float64 384kB 0.907 ..... y (chain, draw, y_dim_0) float64 23MB 4.795 ... 788.1 Attributes: created_at: 2024-05-11T12:17:52.465285+00:00 arviz_version: 0.18.0 -
<xarray.Dataset> Size: 2MB
Dimensions:               (chain: 4, draw: 6000)
Coordinates:
  * chain                 (chain) int32 16B 0 1 2 3
  * draw                  (draw) int32 24kB 0 1 2 3 4 ... 5996 5997 5998 5999
Data variables:
    depth                 (chain, draw) uint64 192kB 1 0 2 0 1 4 ... 3 5 3 4 4 4
    diverging             (chain, draw) bool 24kB False True ... False False
    energy                (chain, draw) float64 192kB 4.27e+08 ... 756.2
    energy_error          (chain, draw) float64 192kB -2.156e+04 0.0 ... 0.05801
    index_in_trajectory   (chain, draw) int64 192kB 1 0 3 0 0 ... 16 -3 14 -7 9
    logp                  (chain, draw) float64 192kB -4.227e+08 ... -754.1
    maxdepth_reached      (chain, draw) bool 24kB False False ... False False
    mean_tree_accept      (chain, draw) float64 192kB 1.0 0.0 ... 0.7959 0.8894
    mean_tree_accept_sym  (chain, draw) float64 192kB 0.0 0.0 ... 0.8221 0.9397
    n_steps               (chain, draw) uint64 192kB 1 1 4 1 3 ... 15 15 15 15
    step_size             (chain, draw) float64 192kB 0.1 1.439 ... 0.4262
    step_size_bar         (chain, draw) float64 192kB 0.1 1.439 ... 0.5043
Attributes:
    created_at:     2024-05-11T12:17:52.495279+00:00
    arviz_version:  0.18.0
az.plot_trace(idata, var_names=["meanmean", "separation", "offset", "mean", "std"], combined=True)
plt.tight_layout()
plt.show()
summary = az.summary(idata, var_names=["~y", "~baseline", "offset"])
summary
| mean | sd | hdi_3% | hdi_97% | mcse_mean | mcse_sd | ess_bulk | ess_tail | r_hat | |
|---|---|---|---|---|---|---|---|---|---|
| area[0] | 316.879 | 28.606 | 260.096 | 368.756 | 0.267 | 0.189 | 11447.0 | 5609.0 | 1.0 |
| area[1] | 674.658 | 26.019 | 628.417 | 725.552 | 0.247 | 0.175 | 11094.0 | 6189.0 | 1.0 |
| baseline_intercept | 1115.569 | 39.801 | 1041.960 | 1192.575 | 0.752 | 0.533 | 2805.0 | 3543.0 | 1.0 |
| baseline_slope | -21.651 | 3.153 | -27.610 | -15.693 | 0.060 | 0.042 | 2801.0 | 3638.0 | 1.0 |
| height[0] | 774.967 | 64.153 | 658.831 | 899.934 | 0.748 | 0.529 | 7341.0 | 6375.0 | 1.0 |
| height[1] | 1762.363 | 64.785 | 1639.151 | 1884.930 | 0.731 | 0.517 | 7857.0 | 6440.0 | 1.0 |
| height_log__[0] | 6.649 | 0.083 | 6.491 | 6.803 | 0.001 | 0.001 | 7341.0 | 6375.0 | 1.0 |
| height_log__[1] | 7.474 | 0.037 | 7.407 | 7.546 | 0.000 | 0.000 | 7857.0 | 6440.0 | 1.0 |
| mean[0] | 11.731 | 0.015 | 11.703 | 11.760 | 0.000 | 0.000 | 5173.0 | 5319.0 | 1.0 |
| mean[1] | 12.433 | 0.007 | 12.422 | 12.446 | 0.000 | 0.000 | 12180.0 | 6652.0 | 1.0 |
| meanmean | 12.082 | 0.008 | 12.067 | 12.098 | 0.000 | 0.000 | 5707.0 | 5689.0 | 1.0 |
| noise | 118.698 | 8.156 | 104.081 | 134.331 | 0.086 | 0.061 | 9008.0 | 4975.0 | 1.0 |
| noise_log__ | 4.774 | 0.068 | 4.649 | 4.903 | 0.001 | 0.001 | 9008.0 | 4975.0 | 1.0 |
| offset[0] | -0.351 | 0.008 | -0.366 | -0.336 | 0.000 | 0.000 | 5682.0 | 5867.0 | 1.0 |
| offset[1] | 0.351 | 0.008 | 0.336 | 0.366 | 0.000 | 0.000 | 5682.0 | 5867.0 | 1.0 |
| separation | 0.702 | 0.016 | 0.672 | 0.732 | 0.000 | 0.000 | 5682.0 | 5867.0 | 1.0 |
| separation_log__ | -0.354 | 0.023 | -0.396 | -0.311 | 0.000 | 0.000 | 5682.0 | 5867.0 | 1.0 |
| sn[0] | 6.561 | 0.713 | 5.195 | 7.862 | 0.008 | 0.006 | 7691.0 | 5958.0 | 1.0 |
| sn[1] | 14.918 | 1.163 | 12.746 | 17.075 | 0.013 | 0.009 | 8553.0 | 5860.0 | 1.0 |
| std[0] | 0.164 | 0.017 | 0.134 | 0.199 | 0.000 | 0.000 | 6537.0 | 5798.0 | 1.0 |
| std[1] | 0.153 | 0.007 | 0.140 | 0.165 | 0.000 | 0.000 | 7141.0 | 6114.0 | 1.0 |
| std_log__[0] | -1.814 | 0.106 | -2.006 | -1.612 | 0.001 | 0.001 | 6537.0 | 5798.0 | 1.0 |
| std_log__[1] | -1.879 | 0.044 | -1.963 | -1.800 | 0.001 | 0.000 | 7141.0 | 6114.0 | 1.0 |
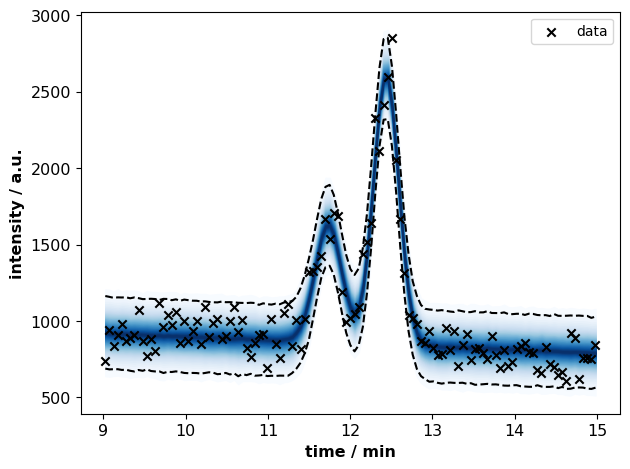
plots.plot_posterior_predictive(
    identifier="peak_fit",
    time=idata.constant_data.time.values,
    intensity=idata.constant_data.intensity.values,
    path=None,
    idata=idata,
    discarded=False,
)
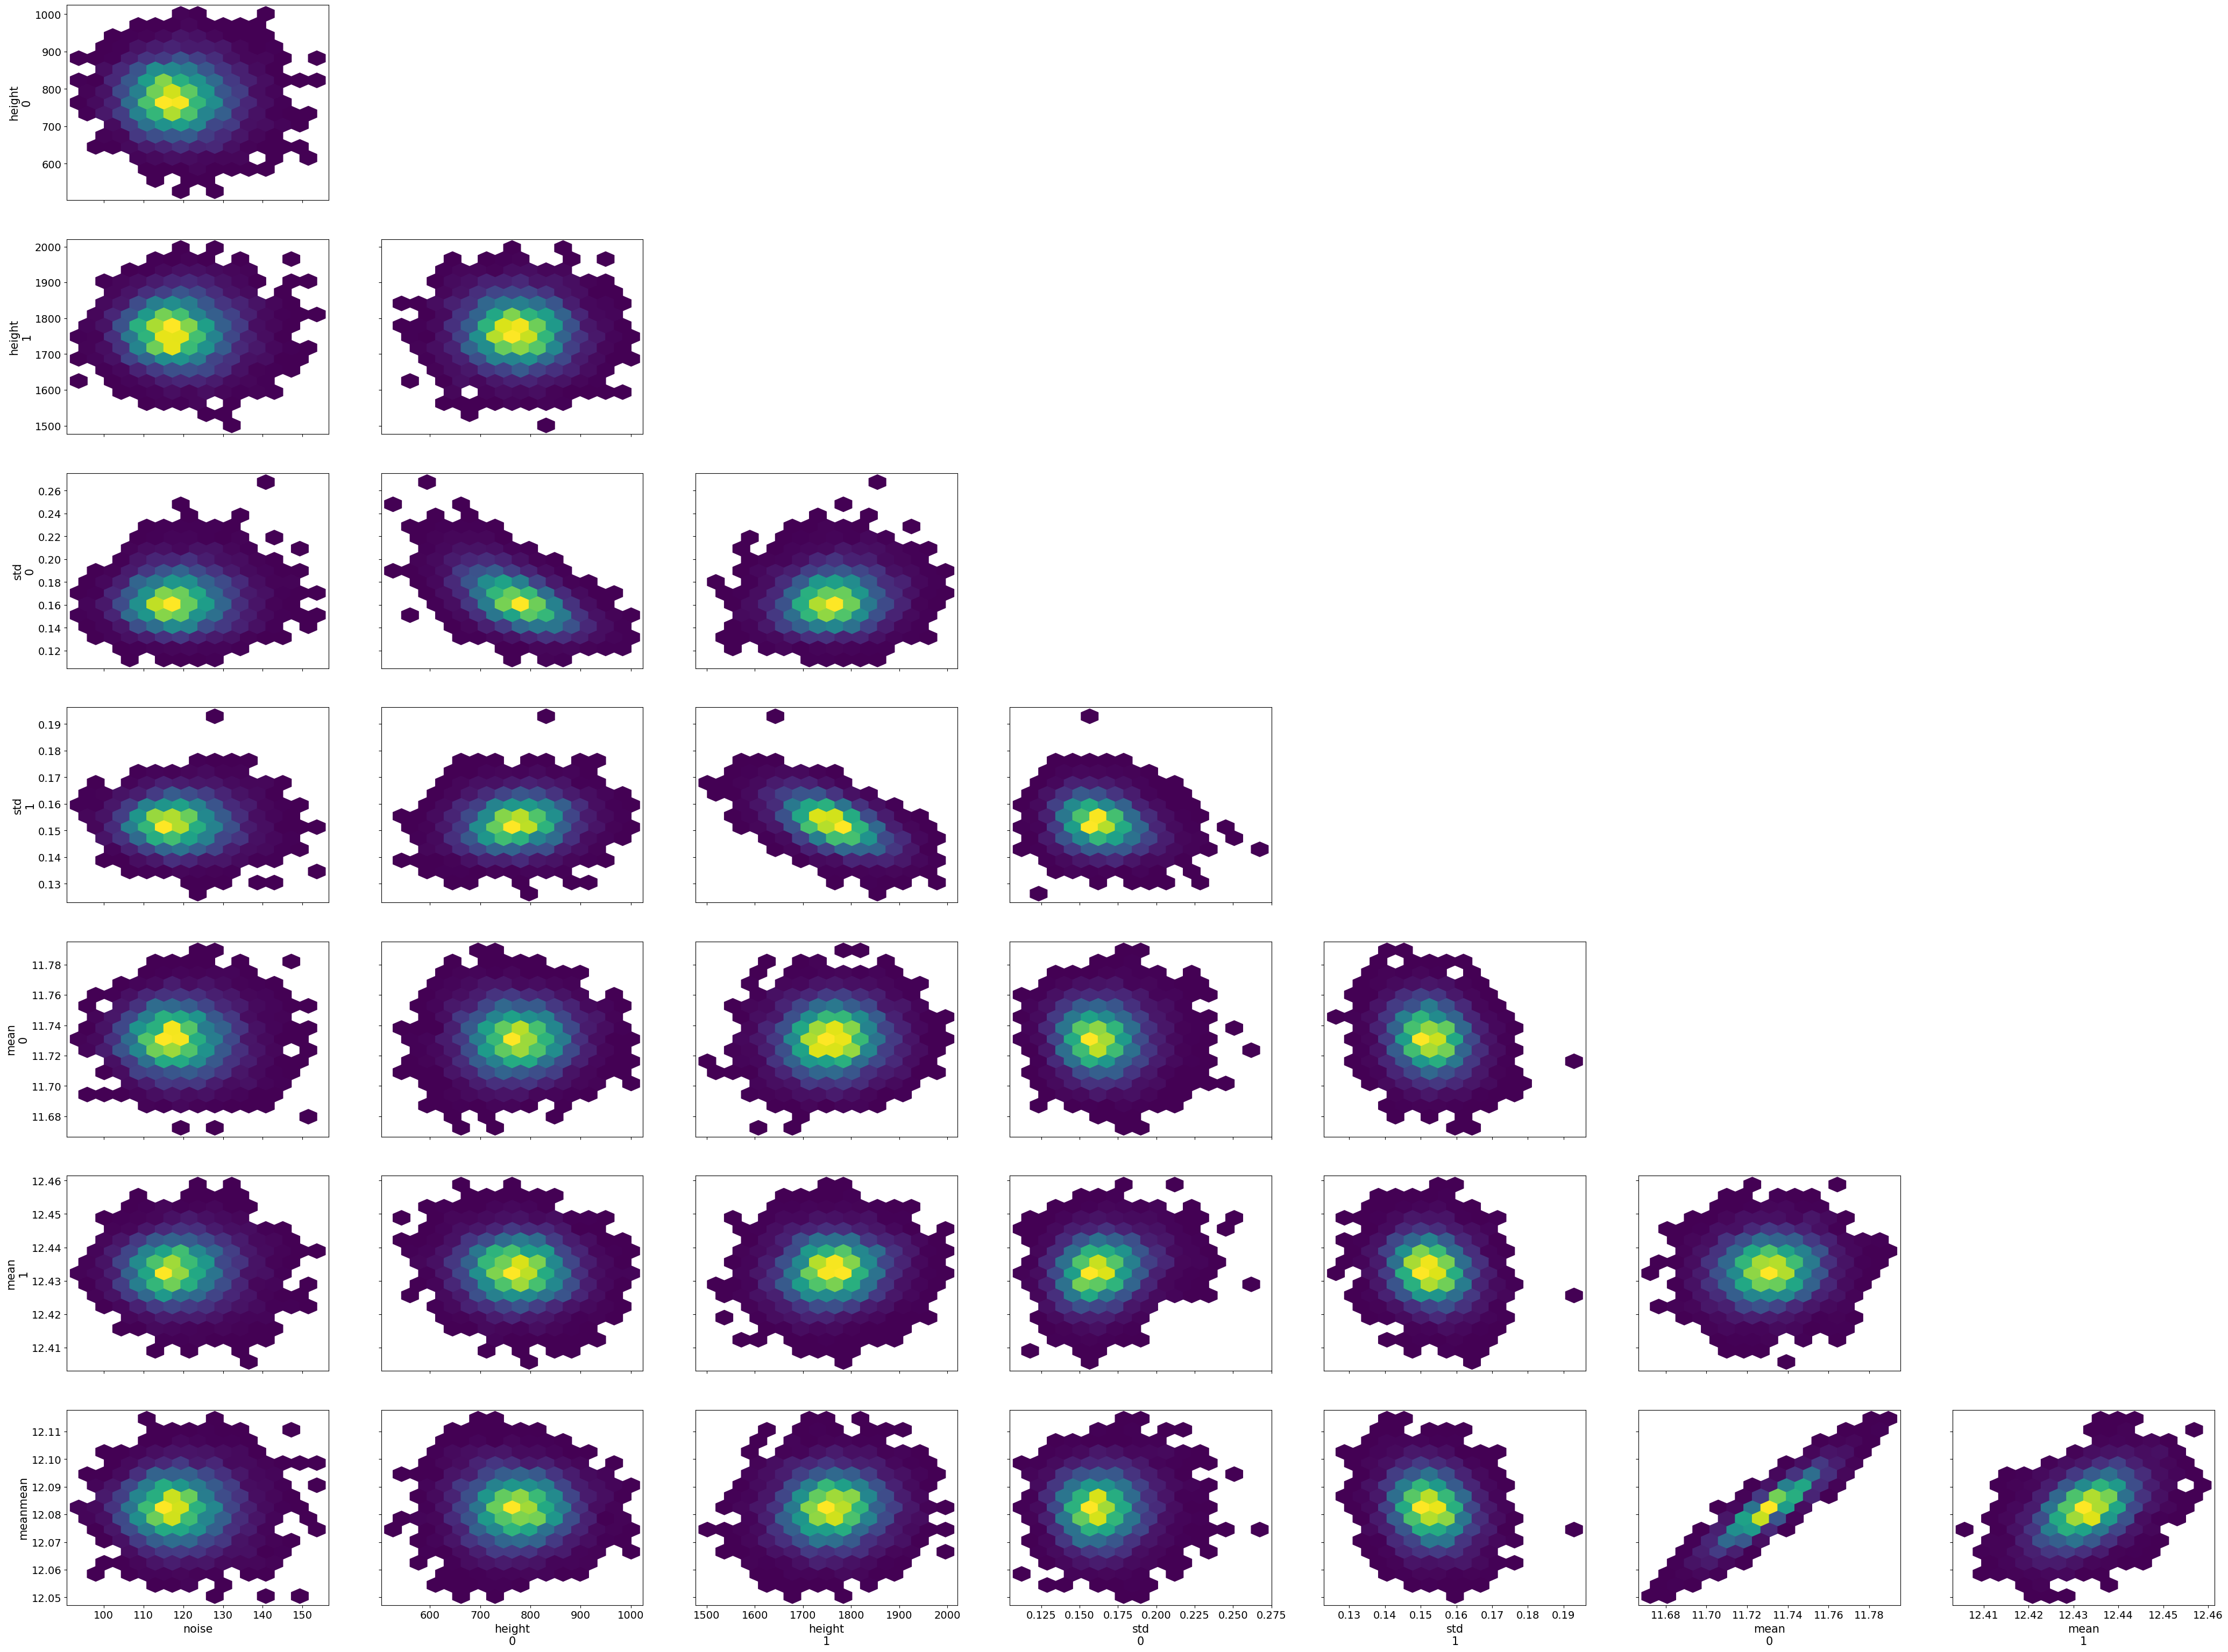
az.plot_pair(idata, var_names="noise,height,std,mean,meanmean".split(","), kind="hexbin");
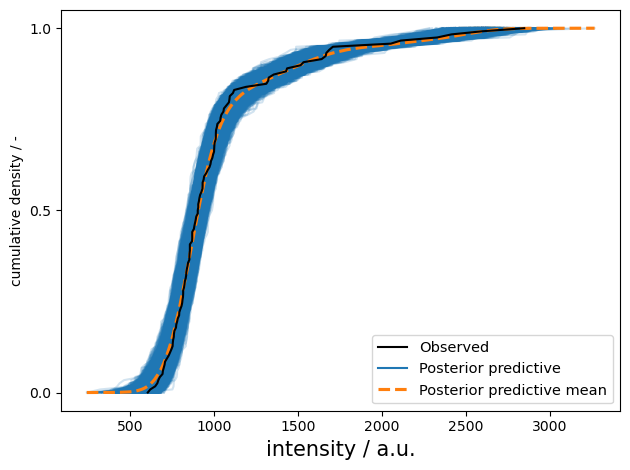
ax = az.plot_ppc(idata, kind="cumulative")
fig = plt.gcf()
ax.set(
    ylabel="cumulative density / -",
    xlabel="intensity / a.u.",
)
plt.tight_layout()
%load_ext watermark
%watermark -idu
Last updated: 2024-05-11T14:18:49.035894+02:00